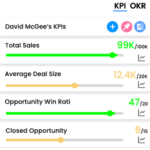
Key Performance Indicators Examples

Most Powerful
OKR APP
in Salesforce
Sprint Burndown Chart / Report
A Sprint Burndown Chart or Report is a tool used in Scrum and Agile software development methodologies to track the progress of work during a sprint. It is a graphical representation of the amount of work remaining in a sprint over time. The chart or report is updated daily, typically during the daily stand-up meeting, to show the progress of the team towards completing the work for the sprint.
The x-axis of the chart or report represents the days of the sprint, and the y-axis represents the amount of work remaining. Each day, the team updates the chart or report to show the amount of work remaining. As the team completes work, the line on the chart should trend downward, indicating that the team is making progress towards completing the work for the sprint.
Here’s a detailed calculation for creating a Sprint Burndown Chart:
- Identify the total amount of work for the sprint in hours or points. This is typically represented on the y-axis of the chart.
- On the first day of the sprint, the total amount of work is plotted on the chart.
- On subsequent days, the team updates the chart to reflect the remaining work. This is typically done by subtracting the completed work from the total amount of work.
- The chart is updated daily and plotted on the x-axis by the days of the sprint.
- The ideal trend line is a diagonal line that starts at the total amount of work on the first day of the sprint and ends at zero on the last day of the sprint, indicating that the team completed all the work for the sprint.
- If the actual trend line deviates from the ideal trend line, it indicates that the team is not on track to complete the work for the sprint on time, and it’s necessary to take action to get back on track.
The Sprint Burndown Chart or Report is a useful tool for the team because it allows them to see how much work they have completed and how much work remains, and whether they are on track to complete the work for the sprint on time. It also allows the Scrum Master, Product Owner, and stakeholders to see the progress of the team and to identify any issues or obstacles that may be preventing the team from completing the work for the sprint on time.
Measure what matters for your business with KPIs
Track business performance with real time key metrics against targets in one place without the need for multiple dashboards or reports