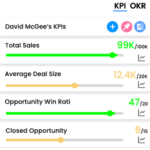
Key Performance Indicators Examples

Most Powerful
OKR APP
in Salesforce
User Error Rate
The percentage of users who make mistakes or errors while attempting to complete a specific task or set of tasks on a website or application is measured by the User Error Rate. It is commonly used to assess a website’s or application’s usability and user-friendliness, as well as user engagement and satisfaction.
A lower user error rate generally indicates that a website or application is simple to use and navigate, whereas a higher user error rate may indicate that users are having difficulty completing specific tasks, or that the design or layout of the website or application is confusing and should be redesigned or improved.
The formula for calculating user error rate is:
User error rate = (Number of errors / Total number of task attempts) x 100
- “Number of errors” is the number of times users made mistakes or errors while trying to complete the task or set of tasks.
- “Total number of task attempts” is the total number of times users attempted to complete the task or set of tasks.
For example, if 100 users attempted to complete a task and 20 of them made mistakes, the user error rate would be 20%.
It is important to note that the user error rate can be calculated for a variety of tasks such as registration, purchase, search, and so on. It is also possible to segment the data based on user characteristics such as demographics, device, location, and so on. This allows you to gain a better understanding of which user groups are making the most mistakes and where improvements can be made.
It is critical to remember that user errors can be caused by a variety of factors such as poor usability, a lack of knowledge, or a poor internet connection. As a result, it’s critical to combine this metric with others, such as task success rate or time-on-task, to get a more complete picture of the user’s experience.
Measure what matters for your business with KPIs
Track business performance with real time key metrics against targets in one place without the need for multiple dashboards or reports