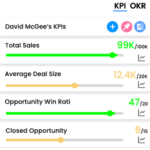
Key Performance Indicators Examples

Most Powerful
OKR APP
in Salesforce
Customer Satisfaction Score (CSAT)
CSAT (Customer Satisfaction Score) is a customer satisfaction metric that measures how satisfied customers are with a product or service. It is typically determined by asking customers to rate their satisfaction with the product or service on a scale, such as 1 to 5, 1 to 7, or 1 to 10, and then calculating the average score. CSAT is used to measure customer satisfaction and loyalty, and to identify areas where the company could improve its product or service.
The formula for CSAT can vary depending on the methodology or survey design that is used, but it is commonly calculated by taking the average of customer satisfaction ratings. For example, if a company asks customers to rate their satisfaction with a product or service on a scale of 1 to 10, where 1 is “very dissatisfied” and 10 is “very satisfied,” the CSAT would be calculated by taking the average of all the ratings.
The most common formula for CSAT (Customer Satisfaction Score) is:
CSAT = (Number of Satisfied Customers / Total Number of Surveyed Customers) * 100%
It is calculated by taking the number of customers who rated their satisfaction as satisfactory or higher (usually above a certain threshold, such as a rating of 7 out of 10), and dividing it by the total number of surveyed customers. The result is then multiplied by 100% to express the result as a percentage.
Another way of calculating CSAT is to take the average of the customer satisfaction ratings, for example, if the scale used is 1 to 5, the formula would be:
CSAT = (Sum of all ratings / Number of Responses)
It’s important to note that the survey design and the rating scale used can affect the final formula, but the goal remains the same, which is to measure the level of satisfaction customers have with a product or service and identify areas where the company could improve its product or service.
Measure what matters for your business with KPIs
Track business performance with real time key metrics against targets in one place without the need for multiple dashboards or reports