View Funnel Dashboard Component
HUB
OKR
- Create OKR
- OKR without KR
- Create Milestone Key Result
- Create Sobject Key Result
- Sample Sobject
- Sample KPI Filters
- Create Split Target for Key Results
- Create Linked OKR Key Result
- Create Link KR Key Result
- Team Access Only OKRs
- Private OKRs
- Strategic Pillar
- Create KPI Key Result
- Create Report Key Result
- Edit/View OKR
- Add Contributors for Key Results
- Clone OKR
- Clone Key Result
- Close OKR & Add Review Score
- Pause and Unpause OKR
- Save OKR as a Template
- OKR Weights
- Links to OKRs
Create OKR from Template
Update Key Result
Hierarchy & Heatmap
KPI
Scorecard
Contest
Recognition
Funnel
Others
- OKR Reports
- OKRify Dashboards
- Create Teams and Team Members
- Create Periods
- Settings
- Setup Email Notification
- Update Email Template – Key Result Overdue Notifications
- Create New Salesforce Report
- Create new Salesforce Dashboard
- How to search for Tags
- View risk and progress for Objectives and Key Results
- Notifications for Overdue Key Results
- OKR Buttons for Related Objects
- Add an Object as a custom field on OKR
Users in the funnel chart have the ability to view the charts within the Lightning page where the Funnel Dashboard LWC has been included such as Sales App home page.

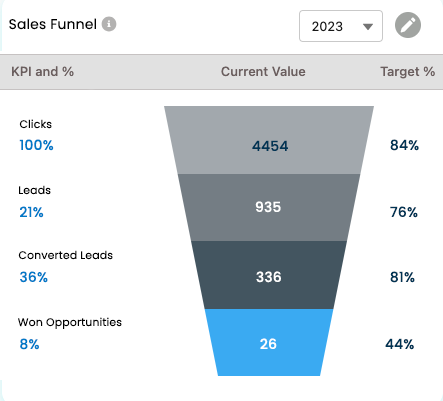
Funnel chart will include the following details
- KPI’s current values
- % of KPI ( KPI Value/ Previous KPI Values)
- Target % (Optional if target is provided for the KPI)
- Target value - (Actual target value can be viewed by hovering over the target %)
Click the info icon next to the Funnel chart name to view the detailed description of the funnel chart.
Select a different time frame from the dropdown menu to visualize the funnel chart data for the corresponding periods
Funnel chart owners will find an accessible edit button for making modifications to the chart.