View Scorecard & Leaderboard

Scorecards can be viewed by users and managers of the Scorecard. Scorecard is visible in Hub or can be added to any Salesforce lighting page such as Sales Home page. Scorecard views are different for the users and the managers of the Scorecard.

User View

Scorecard will display the overall score for the user and the current progress for the KPIs based on the user’s records in Salesforce.

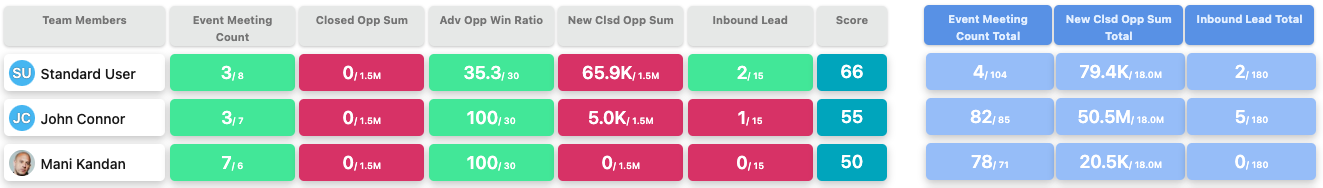
User Score : Score for each user is based on the current progress against the expected progress of all the KPIs in the Scorecard.

Progress/Target : Current progress and the target for each KPIs are displayed, the progress bar is also displayed and the color of the progress bar is based on the risk calculated for the KPI based on the current progress against the expected progress.

Progress Graph & View Records : Click the progress graph icon to view the progress graph. Click View Records to view the records behind the progress value, click filter icon to add more fields to display in the view records.

History : Change the time frame to previous values to view data for the previous time frame.

Leaderboard : Leaderboard icon will be available to open Leaderboard if Leaderboard is enabled for users

Manager View

Managers will have the manager icon for the Scorecard. Managers can also edit a scorecard by clicking the edit icon

Manager will view the data for all the users in the Scorecard, the data is overall progress and target for all the users in the Scorecard. Managers will also be able to see Scorecards in draft or pause status. Managers can view the information for all the users in the scorecard by clicking the Leaderboard Icon.

Leaderboard

Leaderboard provides an overall view of all Scorecard users’ information in one view, Leaderboard is available for the managers and for users if Leaderboard is enabled for the users.

Leaderboard displays KPIs values for all the users in the Scoreboard and is sorted by the user’s score. The KPIs are colored based on the current progress against the expected progress. Historical information can also be viewed for Leaderboard by changing the time frame in the Leaderboard.

Leaderboard with Annual Values

Leaderboard displays annual values for the KPIs for which the flags are selected when creating Scorecard in addition to the Monthly and Quarterly values.

Note: Please be aware that the Scorecard has a maximum capacity of 50,000 records. Therefore, it's important to consider which KPIs are enabled to display annual values to ensure that this capacity is not exceeded. If you get errors, please disable the annual values flag for the KPIs that have more than 50,000 records for the year.

Below is an example Leaderboard with Annual Values